ウォーターフォールチャート表示バグ調査レポート
問題の概要
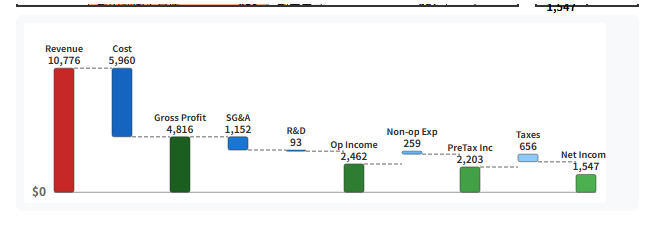
/financial-quiz/proportional-animation ページのウォーターフォールチャートで、費用項目の計算が視覚的に合わないように見える問題が発生。
報告された症状
Linde plc (LIN) 2015年データで確認:
- Gross Profit (4,816) - SG&A (1,152) - R&D (93) = 3,571
- しかし Operating Income は 2,462 と表示
- 差額: 1,109 が説明されていない
調査結果
1. データの整合性(問題なし)
financial-data.ts の LIN 2015年データを確認:
"plDetailed": {
  "revenue": 10776,
  "costOfRevenue": 5960,
  "grossProfit": 4816,
  "sgaExpenses": 1152,
  "rdExpenses": 93,
  "daExpenses": 0,
  "otherOperatingExpenses": 1109,  // ← これが表示されていない!
  "operatingIncome": 2462,
  "nonOperatingIncome": 0,
  "nonOperatingExpenses": 259,
  "preTaxIncome": 2203,
  "taxes": 656,
  "netIncome": 1547
}
検証計算:
4816 - 1152 - 93 - 0 - 1109 = 2462 ✓
データ自体は完全に整合している。
2. UIコンポーネントのバグ(根本原因)
app/components/financial-quiz/PLWaterfallChart.vue の calculateWaterfallPositions 関数を確認:
// 処理されている項目
// 4. SG&A(販売費及び一般管理費)
if (d.sgaExpenses > 0) { ... }

// 5. R&D(研究開発費)
if (d.rdExpenses > 0) { ... }

// 6. D&A(減価償却費)
if (d.daExpenses > 0) { ... }

// ⚠️ otherOperatingExpenses の処理がない!

// 7. Operating Income (結果表示)
otherOperatingExpenses を処理するコードが存在しないのが根本原因。
3. テストコードの限界
tests/waterfall-integrity.test.ts のテストは データの整合性のみ を検証しており、UIコンポーネントの表示ロジック はテストしていない。
さらにテスト内の buildPLDetailedData 関数では、以下のようになっている:
return {
  // ...
  rdExpenses: 0,           // ← 固定値
  otherOperatingExpenses: 0,  // ← 固定値
  // ...
}
実際のデータでは rdExpenses や otherOperatingExpenses が 0 以外の値を持つケースがありますが、テストではこれらを考慮していません。
問題の分類
| 項目 | 状態 | 説明 |
|---|---|---|
| データ整合性 | ✅ 正常 | SQLite → TypeScript の変換は正しい |
| テストコード | ⚠️ 不十分 | データの整合性のみ検証、UIロジックは対象外 |
| UIコンポーネント | ❌ バグ | otherOperatingExpenses の表示処理が欠落 |
修正方針
1. PLWaterfallChart.vue の修正
D&A の後に otherOperatingExpenses を追加:
// 6. D&A(減価償却費)
if (d.daExpenses > 0) {
  // ... 既存コード
}

// 7. Other Operating Expenses(その他営業費用)← 追加
if (d.otherOperatingExpenses > 0) {
  positions.push({
    id: 'other',
    label: 'Other',
    value: d.otherOperatingExpenses,
    startValue: currentLevel,
    endValue: currentLevel - d.otherOperatingExpenses,
    type: 'expense',
    isLoss: false
  })
  currentLevel = currentLevel - d.otherOperatingExpenses
}

// 8. Operating Income (結果表示 - DB確定値)
また、色定義に other を追加:
const COLORS: Record<string, string> = {
  // ... 既存
  other: '#42A5F5',  // Other Operating Expenses(青系)
}
2. テストコードの拡張(オプション)
UIコンポーネントのテストを追加し、すべての費用項目が表示されることを検証:
otherOperatingExpenses > 0の場合に "Other" バーが存在すること- 各バーの
currentLevelが正しく遷移すること
修正完了
実施した修正
1. UIコンポーネントの修正 (PLWaterfallChart.vue)
otherOperatingExpensesの処理を追加(正の値は費用、負の値は収益として表示)- 色定義に
other: '#42A5F5'を追加 - 収益の場合は赤系の色
#EF5350を使用
2. テストコードの拡張 (waterfall-integrity.test.ts)
新しいテストセクション「UIコンポーネント表示ロジック検証」を追加:
simulateUICurrentLevel()関数でUIのcurrentLevel遷移をシミュレート- 各中間ポイント(Gross Profit, Operating Income, Pre-Tax Income, Net Income)でDB値と比較
- 1622期間すべてで整合性を検証
修正後の検証結果
テスト結果:
=== UI表示整合性サマリー ===
合計: 1622期間
成功: 1622期間
失敗: 0期間
ブラウザ表示確認 (LIN 2015年):
Gross Profit (4,816) - SG&A (1,152) - R&D (93) - Other (1,109) = 2,462 ✓
"Other: 1,109" が正しく表示されるようになった。
結論
テストが通ったのにUIで計算が合わなかった理由:
- テストは データの数学的整合性 を検証(これは正常)
- しかし UIコンポーネントの表示ロジック はテスト対象外だった
- UIコンポーネントに
otherOperatingExpensesの処理が欠落していた
テストとUIは別のレイヤーであり、今回のバグはUIレイヤーにのみ存在していた。
今後の対策: UIコンポーネントの表示ロジックもテストに含めることで、同様のバグを早期に検出できるようにした。